
Point & Figure Charts
Version 1.1.2
Commercial Demo
$130.00
0 downloads
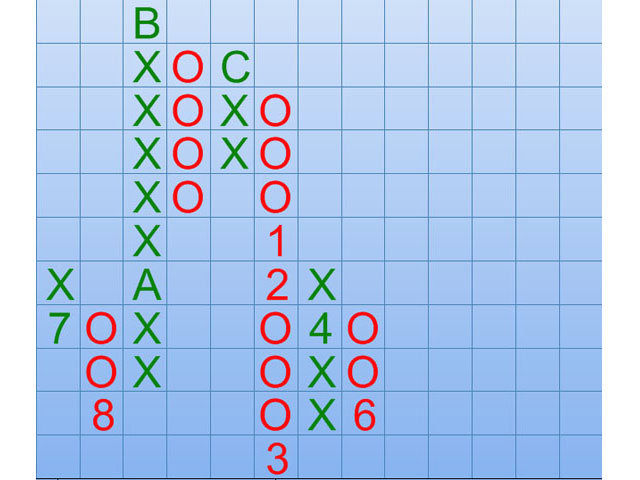
Point & Figure Charts software is an interactive stock
analysis tool. It can create various technical
indicator charts to help users identify buy-and-sell
signals. It takes market stock data from
Yahoo,Opentick and data in MetaStock format. It is
packaged with a free downloader to download stock data
from the Internet.
The Premier Feature:
Point & Figure Chart is implemented with classic scale
ad custom scale. With one click users will get Point &
Figure chart with various technical indicators.
Key Features:
Candlestick, Three Line Break (TLB), KAGI, MACD,
stochastic oscillator and Bollinger Band & Envelope.
Most frequently used, powerful moving averages:
* SMA : Simple Moving Average
* EMA : Exponential Moving Average
Program details
Publisher
Numeral Technology LLC Technical SupportE-mail
Contact the publisherHome page
http://www.numeraltechnology.com/Platforms
Windows 2000<br>Windows XPFile size
56058 KBFile date
9/14/2008License
Commercial DemoInstallation
Install & UninstallRecord updated
6/12/2009