
Advanced Graph and Chart Collection
Version 3.3
Shareware
$199.95
0 downloads
Add Powerful reporting features to your Web / Intranet
pages and applications.
With the advanced graphing package you will be quickly
adding impressive dynamic charting capabilities
bringing your data alive !
Powerful components provide both client & server side
solutions for adding graphs & charts into web /
intranet pages & applications. Enabling web authors &
Java developers to easily build and publish dynamic
interactive graphs & charts.
Each chart contains many configurable features and
functions. The documentation and examples are designed
to give both a full understanding of every feature and
enable you to implement both the applets and servlets
quickly and easily.
The applets and servlets can acquire data from a
variety of sources including,
· Files
· Databases
· Scripts and server Side processes (eg.
Servlets, JSP, ASP, PHP, PERL)
· HTML parameters
Chart Types
· Pie Chart
· Vertical Bar Graph (Column Chart)
· Horizontal Bar Graph
· Line Graph
· Area Graph
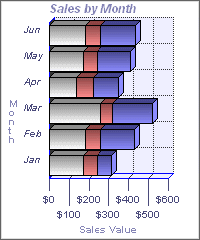
· Stacked Horizontal Bar Graph
· Stacked Vertical Bar Graph
Main Features Summary
· 2D/3D Graphing Mode
· Various Data Sources (Files, Databases,
Scripts/Server processes, HTML parameters).
· JavaScript interaction.
· Printer Friendly
· Labels On/Off, Font and Color Selectable
· Target Lines
· Trend Lines
· Multiple Plots
· Configurable Point Symbols
· Automatic Legend Generation
· Configurable Number of decimal places to show
values
· Label Orientation
· Configurable Depth of the 3D effect
· Display Values on Mouse Over events
· URL link on Mouse Click Events
· Up to 10 Free Form Images can be incorporated
into the Chart Canvas
· Up to 10 Free Form Lines of Text can be
incorporated into the Chart Canvas
Program details
Publisher
Patrick OBrienE-mail
Contact the publisherPlatforms
Windows 95<br>Windows 98<br>Windows ME<br>Windows File size
214 KBFile date
12/10/2003License
SharewareInstallation
No InstallRecord updated
11/25/2003


